What are crypto charts?
Crypto charts, also known as cryptocurrency charts, are graphical representations of the historical prices, trading volume, and market cap of different cryptocurrencies listed on exchanges.
These charts are fundamental tools for traders and investors to understand the trends and movements in the cryptocurrency market.
They offer a visual interpretation of a large set of data, making it easier to spot patterns and changes in cryptocurrency prices.
Crypto charts can provide a snapshot of the market sentiment at any given moment. They help in determining the current value of a cryptocurrency, its circulating supply, and other vital statistics that can influence investment decisions.
By analysing cryptocurrency charts, investors can make informed decisions about buying or selling crypto coins.
But it's important to remember that crypto charts should not be used as sole investment advice. Instead, they should be combined with other research methods, such as studying news about cryptocurrency projects and the overall industry.
What is technical analysis when analyzing crypto charts?
Technical analysis is a method used by traders to predict price movements in the future based on market data gained from past movements. This type of analysis mainly involves studying the patterns and trends on cryptocurrency charts.
When conducting technical analysis, traders use various methods and indicators. One of the most popular methods is Dow theory.
What is Dow theory and why it matters
Dow Theory is a concept that originated from the stock market but is now extensively applied in the crypto world.
The theory, which is named after Charles Dow, who co-founded Dow Jones & Company and also the Wall Street Journal, postulates that the market, as represented in charts, reflects all available information.
Dow Theory suggests that market prices move in trends – uptrends, downtrends, and sideways trends – and these trends continue until significant evidence suggests they have ended.
Recognising these trends on cryptocurrency charts is crucial for making effective trading decisions.
What are Bull and Bear markets in Dow theory?
Dow Theory encompasses a variety of market trends, key among them are primary trends that can endure for over a year, embodying the well-known bull and bear markets.
In a bull market, a general upward trend in prices is observed. It typically comprises three stages:
- The first is the accumulation phase, where informed investors start buying, causing a moderate price increase.
- Then, the public participation phase ensues, as the trend becomes widely noticed and a large number of investors jump in, amplifying the rise.
- The final stage, the excess phase, witnesses a rapid price surge often fueled by unchecked optimism and even speculative behavior, at which point savvy investors start to sell off their holdings.
Conversely, a bear market indicates a general decline in prices. It also has three phases:
- The distribution phase, where informed investors begin to sell off their holdings based on adverse market signals.
- The public participation phase, where more investors follow suit and the downward trend strengthens.
- The final phase, panic or despair, sees a rapid sell-off as a majority of investors try to exit the market to cut losses.
It's worth noting that these cycles of bull and bear markets are crucial aspects of the financial markets that investors and traders must understand to make strategic decisions.

What are candlestick charts?
Candlestick charts originate from Japan over 100 years ago, and are one of the most popular types of cryptocurrency charts. This chart type visualises price movements in a specific time period.
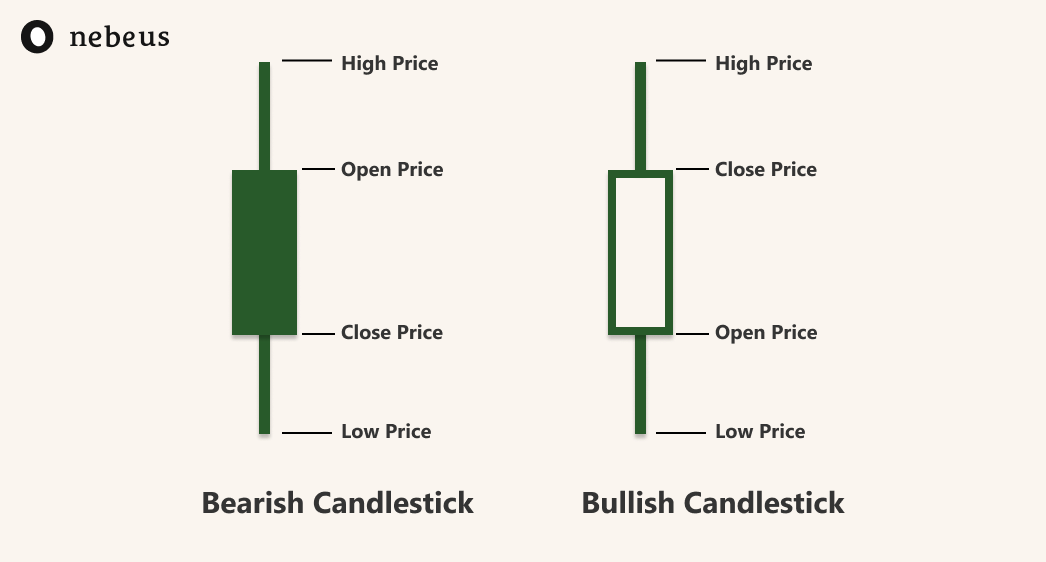
Each 'candlestick' represents the opening, closing, high, and low prices of a cryptocurrency like Bitcoin during the selected time frame.
The 'body' of the candlestick represents the range between opening and closing cryptocurrency prices, while the 'wick' shows the highest and lowest reached.
In candlestick charts, full and outlined candlesticks signify different market sentiments.

A full candlestick, colored red or black, means the closing price was lower than the opening price, indicating a bearish trend.
An outlined candlestick, usually green or white, signals that the closing price was higher, reflecting a bullish trend. This visual differentiation makes candlestick charts highly informative for traders.
Candlestick charts are used a lot among traders as they provide more information than simple line charts, making them a valuable asset when conducting technical analysis.
What are moving averages + Formula?
Moving averages are one of the most commonly used indicators in technical analysis. A moving average is the average price of a cryptocurrency over a specific period of time, and it helps to smooth out price data by creating a constantly updated average price.
Moving averages come in two main types:
- Simple Moving Average (SMA)
- and Exponential Moving Average (EMA).
The Simple Moving Average formula is:
SMA = (A1 + A2 + ... + An) / n
In this formula, A1 to An are the asset prices for n periods, and n is the number of periods.
In other words, SMA is an average of the closing prices over a certain period. To calculate a 5-day SMA, you'd sum the last 5 days' closing prices and divide by 5. As new days get added, the oldest ones get removed, thus the average "moves."
The EMA offers a more sensitive alternative by giving more weight to recent data, thus reacting faster to price changes. While the formula for EMA is a bit more complex, it's usually calculated automatically on most trading platforms and crypto charts.
Why It's Crucial for Crypto Traders to Know How to Read Crypto Charts
Reading and interpreting cryptocurrency charts is a crucial skill for anyone involved in the trading of cryptocurrencies. Whether you're trading Bitcoin or any other crypto coin, charts can provide a wealth of information about past and potential future performance.
Charts can reveal trends in the cryptocurrency market, help identify potential investment opportunities, and alert traders to possible risk areas. They also allow traders to monitor the market sentiment, which can be a significant influence on cryptocurrency prices.
Understanding crypto charts can also help traders to manage their risk and ensure they are making much more informed decisions about when to exit or enter a trade.
However, as with all forms of trading, there's always a level of risk involved – and understanding charts doesn't guarantee success.
What is the Best Chart for Cryptocurrency?
The best chart for cryptocurrency trading depends largely on your personal trading style and goals. Many traders prefer candlestick charts because they provide a lot of information at a glance and are easy to read.
However, others might prefer bar charts, line charts, or even more advanced chart types like Renko charts or Heikin Ashi charts.
When selecting the best chart for you, consider your level of trading experience, your understanding of different chart types, and the specific data you want to track.
Where to Find Crypto Charts?
Cryptocurrency charts can be found on a variety of platforms. Crypto exchanges like Binance, Coinbase, and Kraken provide their own charts for each cryptocurrency listed on their platform.
In addition, there are dedicated charting platforms like TradingView, which offer a large range of indicators and tools, all to help traders analyze the cryptocurrency market.
These platforms provide real-time data, which can be vital for making quick trading decisions. They also allow users to customize their charts, making them a valuable tool for any crypto trader.
Conclusion
Understanding how to read cryptocurrency charts is a fundamental skill for anyone interested in trading or investing in the crypto market. By understanding how to analyze charts and utilize technical analysis, you can gain a better understanding of market trends and price movements.
This, in turn, can help guide your trading decisions and potentially increase your chances of making profitable trades.
However, remember that while technical analysis and charts can provide valuable insights, they're not a guarantee of future performance and should not be the only tools used when making investment decisions.
Always consider other factors such as market news, risk tolerance, and your investment goals.
And remember, no matter how attractive a potential trade may seem, never risk more money than you can afford to lose.
You can sign up for a Nebeus account to open an account to bridge crypto and fiat.
La inversión en criptoactivos no está regulada, puede no ser adecuada para inversores minoristas y se puede perder la totalidad del monto invertido.


